Why measure forecasting accuracy - and how to do it?
In this blog post we're diving into the world of forecasting accuracy. We'll explain its essence, unveil the key metrics that measure it, and explore why forecasting accuracy is a game-changer for businesses.

by Christian Montes Schütte, PhD | Assoc Prof, August 28, 2023

In a world shaped by constant change and uncertainty, the ability to foresee future trends and outcomes has become a cornerstone of success in planning. From business strategies to weather forecasts, accurate predictions empower decision-makers to navigate complex landscapes with confidence. But how do we determine the reliability of these predictions? Enter the realm of forecasting accuracy - a crucial tool that transforms uncertainty into actionable intelligence. By understanding and quantifying the accuracy of forecasts, decision-makers gain the power to chart informed paths, allocate resources wisely, and outmaneuver uncertainty. In this blog post, we'll dive into what forecasting accuracy is, the common metrics used and how they impact business performance.
Understanding Forecasting Accuracy
To understand the potential of measuring accuracy for your company, it's essential to get a first grasp the concept itself. Forecasting accuracy refers to how close the predictions made by a forecasting model are to the actual outcomes that eventually occur. In other words, it measures the degree to which a forecast's estimations match the real observed values. A highly accurate forecast implies that the predicted values are very close to the actual data points, while a less accurate forecast indicates a larger disparity between the predictions and the actual outcomes.
Actual values
These are the real, observed values that occur after the forecasted period. They serve as the benchmark against which forecasted values are compared.
Forecasted values
These are the predicted values generated by a forecasting model or method for a specific time period or event. Forecasting models use historical data, patterns, and other relevant information to make these predictions about future outcomes.
In a rapidly changing world, making accurate predictions about the future is a challenge that organizations across a various of industries face on a daily basis. Whether you're a business leader, economist, or supply chain manager, the ability to anticipate future trends and outcomes is valuable. This is where forecasting accuracy comes into play - a key factor that significantly impact the quality of decision-making. High forecasting accuracy indicates that a given model's predictions can be relied upon for making informed decisions, which is crucial for effective planning and resource allocation in various domains.Imagine a scenario where a retail store underestimates the demand for a popular product and faces empty shelves during a peak shopping season. Alternatively, consider an economic analyst who misjudges market trends, leading to financial losses for investors. These situations underscore the importance of accurate forecasts in decision-making. Predicting the future with precision remain an elusive goal. Variability, uncertainty, and unforeseen factors often conspire to create deviations between predicted outcomes and actual results. Understanding forecasting accuracy is pivotal for businesses aiming to make informed decisions based on predictions. However, the road to accurate predictions involves grappling the concept of forecast errors - a crucial component in assessing the fidelity of forecast. Forecast errors are the numerical difference between predicted values and the actual outcomes that unfold over time. In simpler terms, they represent the gaps between what was anticipated and what actually transpired. Forecast errors serve as stepping stones toward refining forecasting accuracy by indicating how closely a forecasting model's predictions align with the real world.
Positive errors occur when predictions fall short of actual values, resulting in an underestimation. Negative errors, on the other hand, arise when predictions exceed actual outcomes, leading to an overestimation.
Common Forecast Accuracy Metrics
Measuring forecasting accuracy is no simple feat. It requires an arsenal of metrics. Whether you're a seasoned analyst seeking to refine your techniques or a newcomer intrigued by the world of predictions, lets demystify the process of measuring forecasting accuracy. These metrics provide numerical values that indicate the extent of discrepancies between forecasted values and actual data point, thus providing an assessment of how well a forecasting model is performing in capturing the underlying patterns and trends in the data. As there exists various different metrics, it's important to select the one that best align with your business and strategic needs.
Mean Absolute Error (MAE)
Mean Absolute Error (MAE) is a measure between the actual and predicted values of a dataset. The metric is calculated by taking the average of the absolute difference between forecasted values and their corresponding actual values. In other words, it measures the average absolute magnitude of errors made by a forecasting model across a set of predictions. The formula for calculating MAE is as follows:

MAE is intuitively interpretable and relatable as errors are measured in the same units as the data. A lower MAE indicates that the model's prediction are, on average, closer to the actual values, implying higher accuracy. Conversely, a higher MAE suggests that the model's predictions are, on average, farther away from the actual values, indicating lower accuracy. However, the metric treats postive and negative errors equally, which might not be appropriate in cases where the direction of errors matters. For example, overestimating sales might have different consequences from underestimating sales.
Mean Absolute Percentage Error (MAPE)
Mean Absolute Percentage Error (MAPE) is a measure of the accuracy of predictions in a dataset, expressed as a percentage. MAPE is computed by taking the average of the absolute percentage differences between forecasted values and their corresponding actual values. It quantifies the average relative error as a percentage of the actual values. The formula is as follows:

MAPE is useful when comparing the accuracy of different models or forecasting methods across datasets, as it allows for standardized comparison of the forecasting performance. MAPE represents the average percentage deviation of the forecasts from the actual values, thus, it ranges from 0% to infinity, where a lower MAPE indicates that the forecasting model's predictions, on average, deviate less from the actual values in terms of relative magnitude. MAPE is better for comparisons as the forecast error is put in relation to sales. However, as all products are given the same weight, it can give very high error values when the sample contains many slow-movers. By using a volume-weighted MAPE, more importance is placed on the top-sellers. The downside of this is that even very high forecast errors for slow-movers can go unnoticed.
Root Mean Squared Error (RMSE)
Root Mean Squared Error (RMSE) is a key metric that offers a comprehensive view of the accuracy of predictions. It takes into account both the magnitude and direction of errors. RMSE measures the average difference between values predicted by a model and the actual values. In other words, it describes the spread of the residuals. It is calculated by taking the square root of the average of the squared differences between forecasted values and their corresponding actual values. The formulas is as follows:
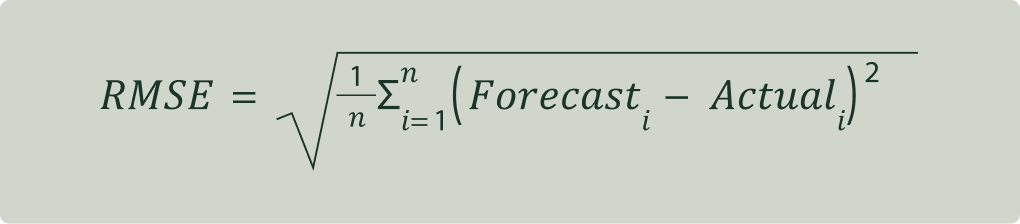
The advantage of using RMSE is that it puts a higher weight on large errors, as the squared difference increases faster than the absolute difference. A lower RMSE indicates that the model's predictions, on average, are closer to the actual values, signifying higher accuracy. Conversely, a higher RMSE suggests that the model's predictions, on average, deviate more from the actual values, indicating lower accuracy.
Forecast Accuracy in a Business Context: Paving the Way to Informed Decisions
In the fast-paced arena of business, foresight is often as valuable as hindsight. This is where forecast accuracy takes center stage. Beyond numbers and metrics, it's a compass guiding businesses toward making well-informed decisions that can shape their success. At its core, forecast accuracy is the strategic advantage that lets businesses anticipate market shifts, consumer behavior, and demand fluctuations. It's the difference between managing inventory smartly or facing stocks, between efficient production planning or wasteful overproduction. The ability to predict what lies ahead empowers businesses to allocate resources wisely, striking the right balance between cost-effectiveness and customer satisfaction. Strategic planning becomes more targeted with accurate forecasts. Marketing campaigns hit the mark when guided by insights into customer preferences, resulting in higher engagement and conversion rates. Product launches become strategic endeavors, aligning with anticipated demand and gaining a competitive edge. In essence, forecast accuracy is the bridge that connects data-driven insights with actionable business strategies. It's the tool that transforms businesses from reactive entities into proactive market players. By tapping into the power of accurate predictions, businesses can not only navigate the uncertainties of the market but also chart a trajectory towards sustained growth and success.
Navigating Tomorrow with Confidence
In conclusion, forecasting accuracy empowers businesses to face tomorrow with confidence. Armed with accurate predictions, businesses are better equipped to seize opportunities, mitigate risks, and make decisions that drive growth. The journey towards achieving accurate forecasts involves meticulous data analysis and careful model selection. In this era where data is king, mastering the art of forecasting accuracy isn't just an advantage - it's a competitive necessity. As you embark on your forecasting journey, remember that the accuracy of your predictions isn't just a metric; it's the difference between stumbling in the dark and forging a path forward. With forecast accuracy as your guide, you're poised to navigate the challenges and triumphs of tomorrow with clarity, precision, and the confidence of a true industry leader.
Ready to embrace your inner nerd? Look no further. Dive into the world of forecasting accuracy with Hakio! If you want to refine your predictive skills, we're here to guide you every step of the way and enhance your forecasting prowess with our state-of-the-art forecasting algorithms. Give us a dial.
Stay ahead of the curve with our expert insights!
Subscribe to Hakio blog for curated insights on innovative demand planning and forecasting techniques. Sign up now and supercharge your strategy with our expert tips delivered straight to your inbox.